 beeboys - stock.adobe.com")
The growing dynamics of our labour markets and resulting more frequent job changes make short periods of unemployment quite normal for a majority of people in contrast to the generations of our parents or grandparents. A large proportion of efforts of the European public employment services focuses on payment of unemployment benefits, making vacancies transparent and, when necessary also quickly ensuring job referrals. Casually speaking, unemployment has therewith lost some of its dramatic character. Long-term unemployment however still remains a great challenge. Risk of poverty, loss of self-confidence and qualifications, and radically sinking chances of employment are just a few of the negative consequences of long-term unemployment. Therefore all PES organisations are intensively and continuously focusing on strategies for fighting long-term unemployment – whether through prevention or intensive efforts directed at reintegration of the long-term unemployed.
For the purposes of European comparisons (EUROSTAT) the long-term unemployed are those who state in surveys run by the central statistical offices in the individual countries to be currently unemployed and to have been searching for employment for longer than one year.
The following report provides an overview of long-term unemployment in European comparison.
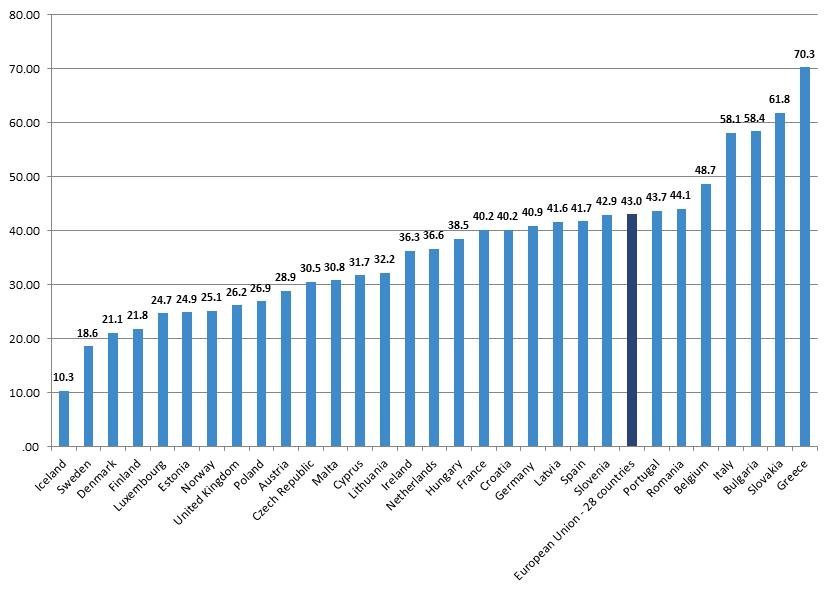
The proportion of the long-term unemployed who have been unemployed for 12 months or longer of all unemployed of age between 15 and 74 has remained in European average at over 40% since 2011 and reached its sad peak in 2014 at 49.3%. Since then this proportion has been reducing; in the annual average of 2018 it amounted to 43%. Labour market situations in EU countries highly differs – with the LTU proportion reaching 10.3% in 2018 in Island and 70.3% in Greece.
In 2018 the proportion of long-term unemployed of all unemployed also continued to sink in EU average when compared with the previous year – by 1.7 percentage points. Eight PES countries recorded an increase, Lithuania with +4.0 percentage points the highest – whereas in Luxemburg this proportion reduced by 13.4 percentage points.

The proportion of long-term unemployed men and women varies on average only insignificantly across all EU member states (43.1% respectively 42.8%). In some countries the proportion of women was however clearly below that of men – in Malta: 22.7% versus 36.%; in Ireland: 31.6% versus 40.1%; in Romania: 38.6% versus 47.1%. In just seven countries the proportion of women was slightly higher, as for instance in Spain with 43.7% (men – 39.6%).
Long-term unemployment development varied strongly across the individual member states over the last decade. Whereas Sweden and Denmark still had a comparably low proportion of long-term unemployed in 2008 which continued growing until 2015 and then decreased over the last few years, Slovakia, Croatia and Bulgaria for instance already had a very high proportion of long-term unemployed ten years ago. In Germany the proportion of long-term unemployed has continuously reduced since 2009. An interactive table at the end of this report offers a visualisation respectively comparison of the developments in individual member states.
7.188 million long-term unemployed were counted in the EU in the annual average of 2018. The development of the absolute number of long-term unemployed in the last ten years shows that it peaked in the EU in 2013, reaching an average of 12.323 million. This peak was however only observed in nine of the EU member states. In Germany long-term unemployment has continuously decreased since 2009, and Estonia and Hungary have recorded a positive development since 2011. In France, Luxemburg, Austria and Norway this growth was only stopped in 2016. In the remaining member states a trend reversal became apparent between 2012 and 2016.
In 2018 in Bulgaria, Greece, Latvia and Slovakia, over 40% of all long-term unemployed were unemployed for four or more years. On the EU average the absolute number of the very long-term unemployed has encouragingly continued to decline since 2015.
Long-term unemployment is primarily concentrated amongst older persons – in 22 EU member states and Norway over 40% of unemployed of age between 50 and 74 were without employment for 12 months or longer, in Slovakia and Greece 76.2% respectively 79.7%. In the age group of 15 to 24 this proportion was over 40% in just five countries: Romania (41.3%), Bulgaria (46.5%), Slovakia (47%), Italy (49.5%) and Greece (53%).

Public Employment Services play a key role in sustainable reintegration of the long-term unemployed (LTU) back into the labour market. In February 2016 the EU Council adopted the “Recommendation on the Integration of the Long-Term Unemployed (LTU) into the Labour Market”.
This Recommendation explicitly requested the European Network of Public Employment Services (the PES network) to contribute to the monitoring of its implementation. This interesting report summarises recent PES developments in integration of the long-term unemployed back into the labour market, offers an overview of the effects of the Recommendation as reported by the PES, and also outlines common challenges faced by the PES.
The following interactive table (please select countries below) demonstrates the proportion of the long-term unemployed of all unemployed in the PES network countries since 2008 in percent / Source: Database – Eurostat une_ltu_ain
Proportion of the long-term unemployed per country
Please select countries below:| wdt_ID | GEO/TIME | 2008 | 2009 | 2010 | 2011 | 2012 | 2013 | 2014 | 2015 | 2016 | 2017 | 2018 |
|---|---|---|---|---|---|---|---|---|---|---|---|---|
| 1 | European Union - 28 countries | 36,9 | 33,1 | 39,7 | 42,8 | 44,3 | 47,1 | 49,3 | 48,1 | 46,4 | 44,7 | 43,0 |
| 2 | Belgium | 47,4 | 44,2 | 48,7 | 48,3 | 44,6 | 46,0 | 49,9 | 51,7 | 51,6 | 48,6 | 48,7 |
| 3 | Bulgaria | 51,7 | 43,3 | 46,1 | 55,7 | 55,2 | 57,3 | 60,4 | 61,2 | 59,1 | 55,0 | 58,4 |
| 4 | Czech Republic | 49,2 | 30,0 | 40,9 | 40,6 | 43,4 | 43,4 | 43,5 | 47,3 | 42,1 | 35,0 | 30,5 |
| 5 | Denmark | 13,5 | 9,5 | 20,2 | 24,4 | 28,0 | 25,5 | 25,2 | 26,9 | 22,3 | 22,6 | 21,1 |
| 6 | Germany | 51,8 | 44,9 | 46,8 | 47,6 | 45,1 | 44,4 | 44,0 | 43,6 | 40,8 | 41,7 | 40,9 |
| 7 | Estonia | 31,1 | 27,3 | 45,3 | 57,3 | 54,7 | 44,5 | 45,3 | 38,3 | 31,6 | 33,5 | 24,9 |
| 8 | Ireland | 25,0 | 27,9 | 47,3 | 56,8 | 59,3 | 57,7 | 55,1 | 53,6 | 50,5 | 44,9 | 36,3 |
| 9 | Greece | 47,1 | 40,4 | 44,6 | 49,3 | 59,1 | 67,1 | 73,5 | 73,1 | 72,0 | 72,8 | 70,3 |
| 10 | Spain | 18,0 | 23,8 | 36,6 | 41,6 | 44,4 | 49,7 | 52,8 | 51,6 | 48,4 | 44,5 | 41,7 |
| 11 | France | 36,6 | 34,5 | 39,5 | 40,7 | 39,6 | 40,2 | 42,5 | 42,6 | 44,2 | 43,8 | 40,2 |
| 12 | Croatia | 62,3 | 55,7 | 56,3 | 61,3 | 63,7 | 63,6 | 58,3 | 63,1 | 50,7 | 41,0 | 40,2 |
| 13 | Italy | 45,2 | 44,3 | 48,0 | 51,4 | 52,6 | 56,4 | 60,8 | 58,1 | 57,4 | 57,8 | 58,1 |
| 14 | Cyprus | 13,6 | 10,4 | 20,4 | 20,8 | 30,1 | 38,3 | 47,7 | 45,6 | 44,4 | 40,6 | 31,7 |
| 15 | Latvia | 24,1 | 25,8 | 45,0 | 54,5 | 52,1 | 48,4 | 42,9 | 45,3 | 41,4 | 37,6 | 41,6 |
| 16 | Lithuania | 21,6 | 23,7 | 41,7 | 52,1 | 49,2 | 42,9 | 44,7 | 42,9 | 38,3 | 37,6 | 32,2 |
| 17 | Luxembourg | 32,4 | 23,1 | 29,3 | 28,8 | 30,3 | 30,4 | 27,4 | 28,4 | 34,8 | 38,1 | 24,7 |
| 18 | Hungary | 46,2 | 41,5 | 48,9 | 47,6 | 45,3 | 48,6 | 47,5 | 45,6 | 46,5 | 40,4 | 38,5 |
| 19 | Malta | 42,7 | 42,0 | 44,9 | 47,3 | 48,8 | 45,9 | 47,5 | 44,2 | 39,7 | 40,1 | 30,8 |
| 20 | Netherlands | 33,7 | 25,1 | 26,8 | 32,3 | 32,9 | 34,9 | 39,2 | 42,9 | 41,5 | 39,5 | 36,6 |
| 21 | Austria | 24,3 | 21,7 | 25,4 | 26,3 | 24,9 | 24,6 | 27,2 | 29,2 | 32,3 | 33,4 | 28,9 |
| 22 | Poland | 33,5 | 30,3 | 31,1 | 37,2 | 40,3 | 42,5 | 42,7 | 39,3 | 35,0 | 31,0 | 26,9 |
| 23 | Portugal | 47,3 | 44,0 | 52,0 | 48,4 | 48,8 | 56,4 | 59,6 | 57,4 | 55,4 | 49,9 | 43,7 |
| 24 | Romania | 41,3 | 31,6 | 34,5 | 41,0 | 44,2 | 45,2 | 41,1 | 43,9 | 50,0 | 41,4 | 44,1 |
| 25 | Slovenia | 42,2 | 30,1 | 43,3 | 44,2 | 47,9 | 51,0 | 54,5 | 52,3 | 53,3 | 47,5 | 42,9 |
| 26 | Slovakia | 69,6 | 54,0 | 64,0 | 67,9 | 67,3 | 70,2 | 70,2 | 65,8 | 60,2 | 62,4 | 61,8 |
| 27 | Finland | 18,2 | 16,7 | 23,8 | 22,0 | 21,2 | 20,6 | 22,1 | 24,4 | 25,7 | 24,2 | 21,8 |
| 28 | Sweden | 12,3 | 13,1 | 18,1 | 19,0 | 18,3 | 17,7 | 18,2 | 19,6 | 18,3 | 18,5 | 18,6 |
| 29 | United Kingdom | 24,1 | 24,5 | 32,5 | 33,4 | 34,7 | 36,1 | 35,8 | 30,7 | 27,1 | 25,9 | 26,2 |
| 30 | Iceland | 5,8 | 17,4 | 23,8 | 25,1 | 18,2 | 12,0 | 12,4 | 9,2 | 10,3 | ||
| 31 | Norway | 12,7 | 15,8 | 20,0 | 23,0 | 18,8 | 19,8 | 22,0 | 22,3 | 25,7 | 27,4 | 25,1 |


Leave a Reply