 Bojan - stock.adobe.com")
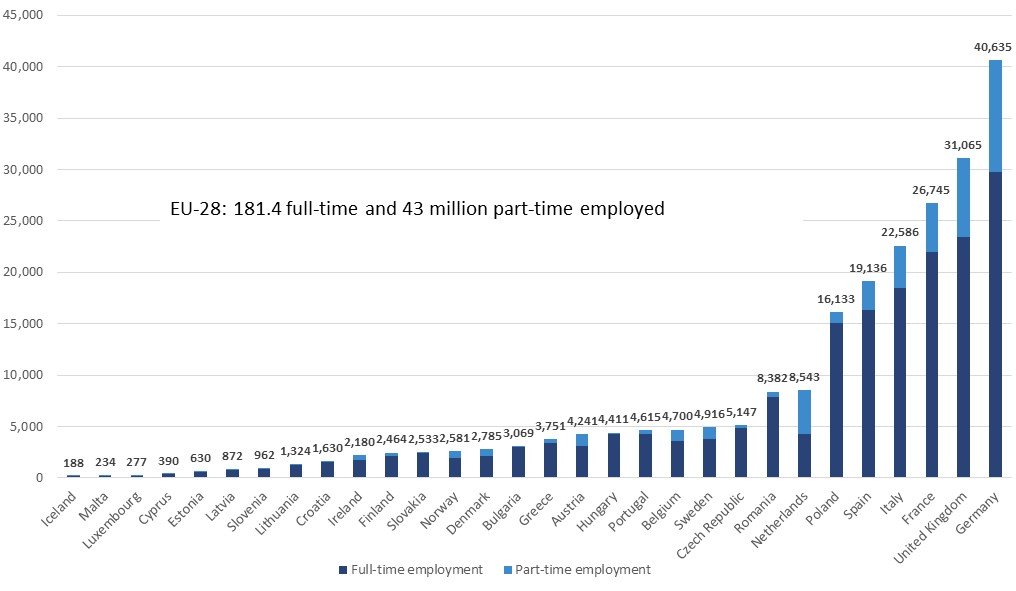
Across the member states of the European Union in the annual average of 2018 181.4 million people of age between 15 and 64 were in full-time employment (110.2 million men and 71.2 million women), a further 43 million were part-time employed (10.5 million men and 32.5 million women).
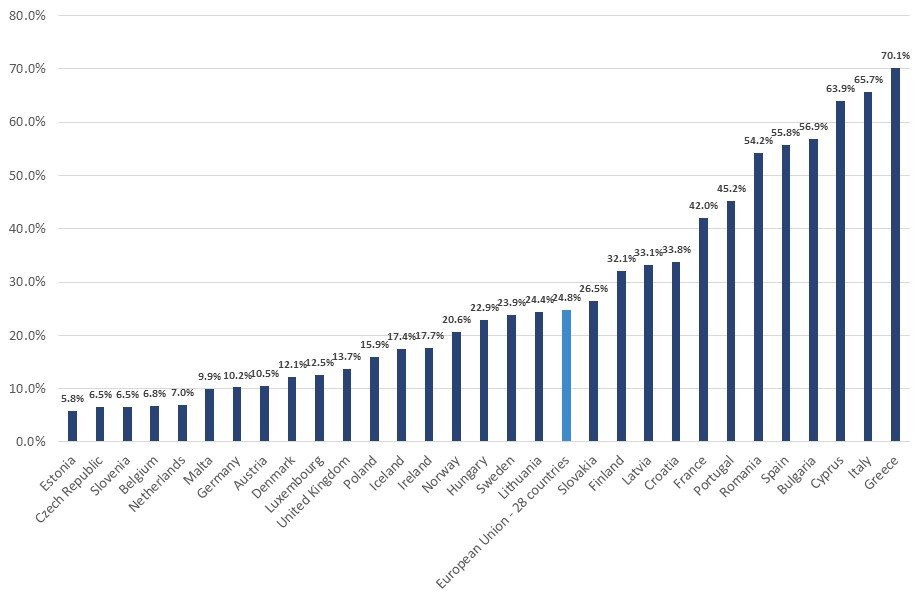
Proportion of part-time employed highest in the Netherlands, Austria and Germany
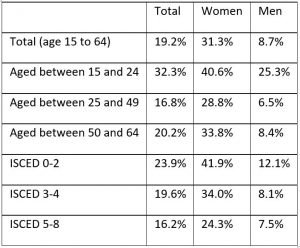
In 2018 the highest proportion of part-time employed was recorded in the Netherlands at 50.1%, Austria at 27.3% and Germany at 26.8%; these countries also had the highest part-time employment rates of women. In the Netherlands this rate was at 75.6%, in Austria at 46.9% and in Germany at 46.3%. Across the European average the proportion of part-time employed men was at 8.7% and women at 31.3%.
Nearly every tenth employed man and almost every third employed woman in the EU are in part-time employment. The rates continue to grow and hence in many member states no longer represent just a side issue. Before the backdrop of opportunities but also risks of part-time employment in the context of for instance shortage of skilled labour, flexibility reserve, care responsibilities and also threat of old-age poverty, it is recommended to analyse this issue in-depth and thoroughly discuss it on not just a European level.
states Johannes Kopf, Chair of the Network of the European Public Employment Services.
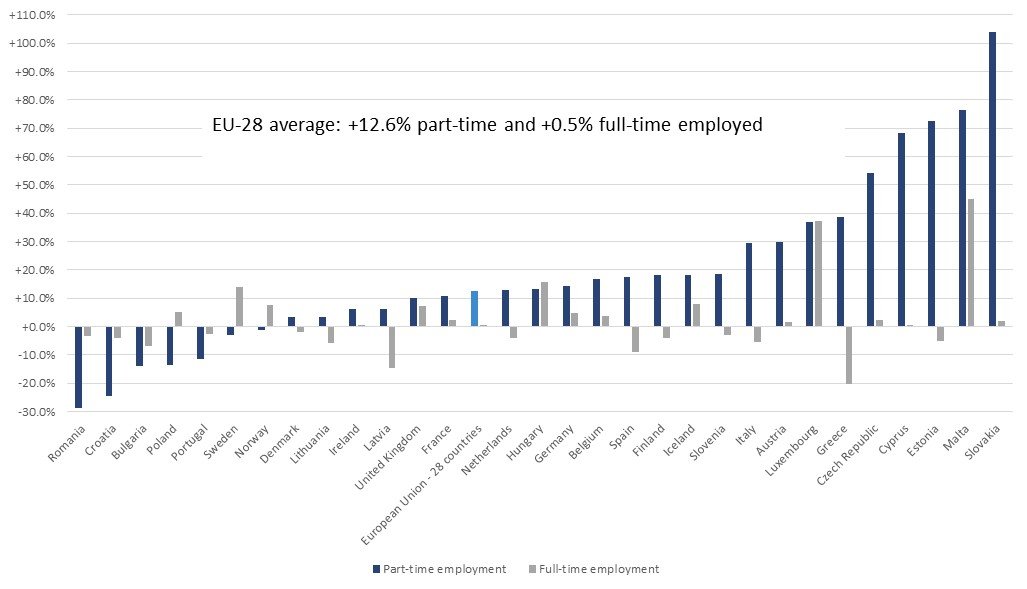
Over the last decade part-time employment across the EU member states grew on average by 12.6%
Full-time employment only showed moderate growth of an average of +0.5% over the last decade and was mostly attributable to the increasing full-time employment of women (+4.0%) since that of men decreased by 1.7%.
The number of part-time employed across the EU member states in 2018 was higher than in 2008 by 12.6%, whereby a clear relative increase of men by 24.5% was recorded compared with women (+9.2%). See all details below.
Across the European average nearly 25% of the part-time employed aged between 15 and 64 are “involuntarily part-time employed”
The reasons for part-time employment are different for men and women, and also show different country specific weighting. On average in Europe the primary reason for men was that they could not find any full-time position, training and occupational further training ranking as the second reason. Women most often stated the obligation to care for children and other relatives, followed by lacking availability of full-time positions. See all details below.
At this point the two most often named reasons should be elucidated more thoroughly. Employed people who could not find any full-time position are also referred to as “involuntarily part-time employed”. On average 24.8% (2018: 22.1% women and 33.4% men) of part-time employed across the European Union include themselves in this group; in 12 states of the PES network this proportion was clearly above the average.
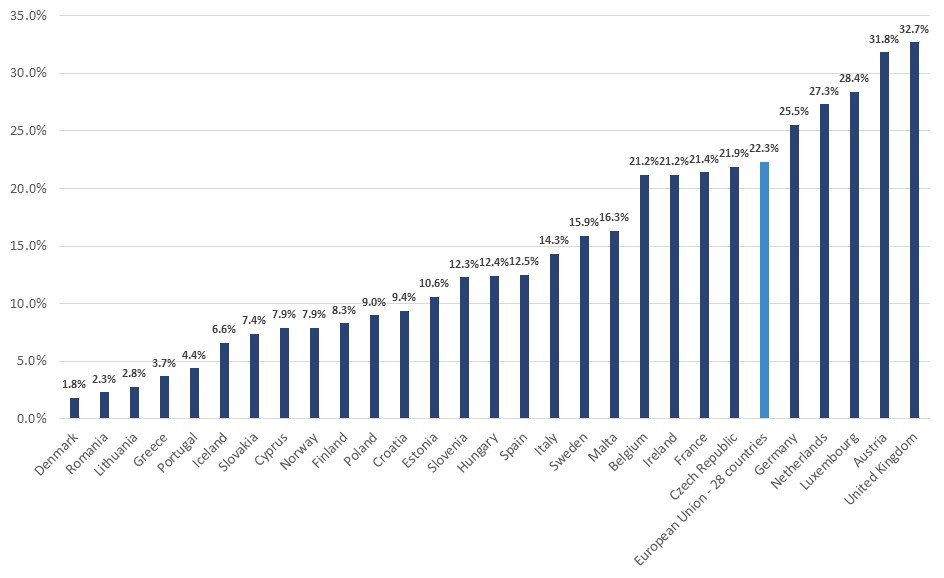
Primarily women stated caring for children and other relatives most often as a reason for choosing part-time employment; on average 22.3% of all persons questioned stated this as a primary reason – however only 5.3% of men but 27.7% of women. Attributable to the insufficient availability of care facilities and different role models within the family, only two of the many reasons for reducing working hours due to family-related obligations may have been stated here.
Note: no data was available for Bulgaria and Latvia
The higher the level of education the lower the part-time employment rate
Across the EU average the part-time employment rate of men and women correlates with the level of education – the higher the level of education the lower the proportion of part-time employment. This correlation is identifiable for the part-time employment rate of women across all member states except for the Czech Republic and Austria.
Full-time positions in the industry and construction sectors are decreasing, the number of positions in the tertiary sector continues to grow
In 2018 only 24% of employed persons worked in production-oriented enterprises and the construction sector whereas in 2008 they still accounted for 28%. In contrast, in the tertiary sector this proportion increased from 67% to 71%.
Over the last decade full-time positions were primarily lost in the industrial and construction sectors. Enterprises operating in the tertiary sector however continued to show extremely high increases in full-time and part-time positions, primarily when rendering freelancer, scientific, technical as well as other commercial services, followed by the tourism, health and social, as well as information and communication sectors.
Details:
Development of full-time employment 2008-2018
| wdt_ID | Countries | Total | Women | Men |
|---|---|---|---|---|
| 1 | European Union - 28 countries | 0,5 | 4,0 | -1,7 |
| 2 | Belgium | 3,6 | 11,2 | -0,4 |
| 3 | Bulgaria | -7,0 | -7,3 | -6,8 |
| 4 | Czech Republic | 2,1 | 4,5 | 0,4 |
| 5 | Denmark | -2,0 | 1,7 | -4,4 |
| 6 | Germany | 4,8 | 7,8 | 3,3 |
| 7 | Estonia | -5,3 | -8,5 | -2,4 |
| 8 | Ireland | 0,2 | 9,0 | -5,0 |
| 9 | Greece | -20,3 | -16,6 | -22,5 |
| 10 | Spain | -8,9 | -1,3 | -13,4 |
| 11 | France | 2,3 | 7,0 | -0,9 |
| 12 | Croatia | -4,2 | 0,7 | -7,9 |
| 13 | Italy | -5,4 | -2,5 | -6,9 |
| 14 | Cyprus | 0,4 | 7,3 | -4,9 |
| 15 | Latvia | -14,8 | -14,7 | -14,8 |
| 16 | Lithuania | -5,8 | -4,3 | -7,3 |
| 17 | Luxembourg | 37,3 | 63,7 | 24,7 |
| 18 | Hungary | 15,6 | 14,2 | 16,8 |
| 19 | Malta | 45,1 | 87,8 | 28,3 |
| 20 | Netherlands | -4,1 | 4,3 | -6,4 |
| 21 | Austria | 1,5 | -0,4 | 2,6 |
| 22 | Poland | 5,1 | 5,8 | 4,7 |
| 23 | Portugal | -2,8 | 6,2 | -10,0 |
| 24 | Romania | -3,5 | -6,9 | -0,8 |
| 25 | Slovenia | -3,1 | -4,3 | -2,2 |
| 26 | Slovakia | 1,9 | 3,4 | 0,8 |
| 27 | Finland | -4,1 | -4,3 | -3,9 |
| 28 | Sweden | 13,7 | 24,2 | 7,4 |
| 29 | United Kingdom | 7,3 | 12,3 | 4,5 |
| 30 | Iceland | 8,1 | 11,9 | 5,8 |
| 31 | Norway | 7,7 | 14,5 | 3,6 |
Development of part-time employment 2008-2018
| wdt_ID | Countries | Total | Women | Men |
|---|---|---|---|---|
| 1 | European Union - 28 countries | 12,6 | 9,2 | 24,5 |
| 2 | Belgium | 16,6 | 12,2 | 35,8 |
| 3 | Bulgaria | -14,0 | -21,7 | -4,5 |
| 4 | Czech Republic | 54,0 | 50,9 | 65,7 |
| 5 | Denmark | 3,2 | -1,8 | 15,1 |
| 6 | Germany | 14,4 | 13,0 | 20,9 |
| 7 | Estonia | 72,5 | 59,3 | 104,3 |
| 8 | Ireland | 6,0 | -0,4 | 25,8 |
| 9 | Greece | 38,7 | 17,1 | 93,7 |
| 10 | Spain | 17,6 | 10,2 | 46,9 |
| 11 | France | 10,7 | 4,0 | 42,8 |
| 12 | Croatia | -24,6 | -20,0 | -30,8 |
| 13 | Italy | 29,6 | 22,1 | 58,7 |
| 14 | Cyprus | 68,1 | 49,7 | 117,1 |
| 15 | Latvia | 6,2 | 13,5 | -6,0 |
| 16 | Lithuania | 3,3 | 3,8 | 2,1 |
| 17 | Luxembourg | 36,8 | 23,6 | 174,2 |
| 18 | Hungary | 13,0 | 23,0 | -3,2 |
| 19 | Malta | 76,6 | 65,9 | 109,3 |
| 20 | Netherlands | 12,8 | 9,2 | 22,5 |
| 21 | Austria | 29,8 | 25,7 | 50,5 |
| 22 | Poland | -13,5 | -8,0 | -23,2 |
| 23 | Portugal | -11,5 | -23,9 | 25,8 |
| 24 | Romania | -28,7 | -32,8 | -24,9 |
| 25 | Slovenia | 18,6 | 37,0 | -7,0 |
| 26 | Slovakia | 104,1 | 84,8 | 150,6 |
| 27 | Finland | 18,0 | 14,7 | 25,0 |
| 28 | Sweden | -3,0 | -10,1 | 18,8 |
| 29 | United Kingdom | 10,0 | 6,9 | 21,5 |
| 30 | Iceland | 18,1 | 14,7 | 28,6 |
| 31 | Norway | -1,4 | -7,8 | 17,3 |
Main reason for part-time employment as percentage of total part-time employment (15-64 years) annual average 2018: member states of the PES network
Reason “Could not find a full-time job”
| wdt_ID | Countries | Total | Men | Women |
|---|---|---|---|---|
| 1 | European Union - 28 countries | 24,8 | 33,4 | 22,1 |
| 2 | Belgium | 6,8 | 11,4 | 5,6 |
| 3 | Bulgaria | 56,9 | 62,3 | 51,3 |
| 4 | Czech Republic | 6,5 | 5,0 | 7,0 |
| 5 | Denmark | 12,1 | 10,9 | 12,7 |
| 6 | Germany | 10,2 | 15,9 | 8,9 |
| 7 | Estonia | 5,8 | 4,5 | 6,4 |
| 8 | Ireland | 17,7 | 32,0 | 11,8 |
| 9 | Greece | 70,1 | 75,4 | 66,5 |
| 10 | Spain | 55,8 | 63,0 | 53,5 |
| 11 | France | 42,0 | 49,2 | 40,1 |
| 12 | Croatia | 33,8 | 36,4 | 32,1 |
| 13 | Italy | 65,7 | 80,3 | 60,8 |
| 14 | Cyprus | 63,9 | 71,5 | 59,6 |
| 15 | Latvia | 33,1 | 40,1 | 29,6 |
| 16 | Lithuania | 24,4 | 26,5 | 23,2 |
| 17 | Luxembourg | 12,5 | 12,1 | 12,6 |
| 18 | Hungary | 22,9 | 30,1 | 19,4 |
| 19 | Malta | 9,9 | 17,7 | 6,8 |
| 20 | Netherlands | 7,0 | 9,7 | 5,9 |
| 21 | Austria | 10,5 | 16,2 | 9,1 |
| 22 | Poland | 15,9 | 16,4 | 15,6 |
| 23 | Portugal | 45,2 | 40,1 | 48,0 |
| 24 | Romania | 54,2 | 64,7 | 41,4 |
| 25 | Slovenia | 6,5 | 3,4 | 8,0 |
| 26 | Slovakia | 26,5 | 30,9 | 24,1 |
| 27 | Finland | 32,1 | 32,3 | 32,1 |
| 28 | Sweden | 23,9 | 27,6 | 22,4 |
| 29 | United Kingdom | 13,7 | 25,9 | 10,0 |
| 30 | Iceland | 17,4 | 14,8 | 18,3 |
| 31 | Norway | 20,6 | 0,0 | 20,8 |
Reason “Looking after children or incapacitated adults”
| wdt_ID | Countries | Total | Men | Women |
|---|---|---|---|---|
| 1 | European Union - 28 countries | 22,3 | 5,3 | 27,7 |
| 2 | Belgium | 21,2 | 7,6 | 24,8 |
| 3 | Bulgaria | 0,0 | 0,0 | 0,0 |
| 4 | Czech Republic | 21,9 | 0,0 | 28,8 |
| 5 | Denmark | 1,8 | 0,0 | 2,5 |
| 6 | Germany | 25,5 | 5,5 | 30,2 |
| 7 | Estonia | 10,6 | 0,0 | 14,5 |
| 8 | Ireland | 21,2 | 5,2 | 27,7 |
| 9 | Greece | 3,7 | 0,0 | 5,8 |
| 10 | Spain | 12,5 | 1,9 | 16,0 |
| 11 | France | 21,4 | 4,9 | 25,7 |
| 12 | Croatia | 9,4 | 3,7 | 13,1 |
| 13 | Italy | 14,3 | 1,2 | 18,6 |
| 14 | Cyprus | 7,9 | 0,0 | 12,1 |
| 15 | Latvia | 0,0 | 0,0 | 0,0 |
| 16 | Lithuania | 2,8 | 0,0 | 4,0 |
| 17 | Luxembourg | 28,4 | 13,4 | 31,7 |
| 18 | Hungary | 12,4 | 0,0 | 17,4 |
| 19 | Malta | 16,3 | 4,6 | 21,0 |
| 20 | Netherlands | 27,3 | 9,2 | 34,1 |
| 21 | Austria | 31,8 | 5,8 | 38,0 |
| 22 | Poland | 9,0 | 1,8 | 12,5 |
| 23 | Portugal | 4,4 | 0,0 | 6,3 |
| 24 | Romania | 2,3 | 0,0 | 4,8 |
| 25 | Slovenia | 12,3 | 5,9 | 15,2 |
| 26 | Slovakia | 7,4 | 0,0 | 11,5 |
| 27 | Finland | 8,3 | 0,0 | 11,9 |
| 28 | Sweden | 15,9 | 9,2 | 18,7 |
| 29 | United Kingdom | 32,7 | 9,7 | 39,6 |
| 30 | Iceland | 6,6 | 0,0 | 8,9 |
| 31 | Norway | 7,9 | 0,0 | 10,6 |


Leave a Reply