 olly - stock.adobe.com")
In 2013 unemployment across Europe reached its depressing peak. The number of unemployed across the European Union reached 26.334 million, the unemployment rate was 10.9%. The labour market situation of young people was particularly precarious, in 2013 the unemployment rate of the EU 28 was on average at 23.8% with 5.640 million unemployed under the age of 25.
After a long period of growing unemployment and difficult economic environment for the activities of the European labour market administrations, the situation today has fortunately turned around again. The unemployment rate throughout the entire year of 2018 was at 6.8%, the number of unemployed compared to the levels in 2013 has in the meantime reduced by over one third. The number of young unemployed reduced by 40%, the unemployment rate in the age group from 15 to 24 decreased by 8.6 percentage points to 15.2% and was below the level of 2013. The pre-crisis levels of the year 2008 have finally been reached across the European Union after ten long years – in 2018 the unemployment rate was on average at 6.8%, i.e. 0.2 percentage points slightly below the level of the year 2008; the number of unemployed in annual average was at 16.887 million in 2018 – minimally over the level in 2008 (16.786 million).
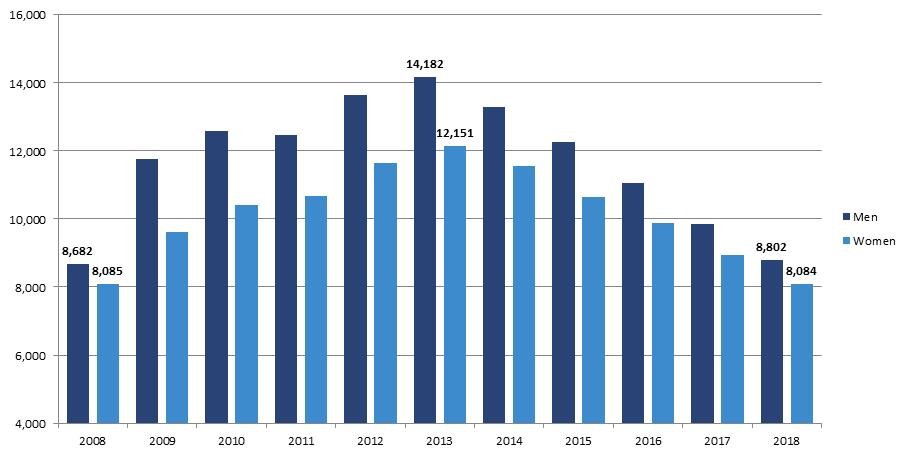
The number of unemployed has decreased over the last five years in virtually all European Union countries and Island (contrary in Luxembourg and the PES network member, Norway). This trend however started evolving at different times – in Croatia, Belgium, the Netherlands, Italy and Cyprus the first trend reversal appeared in 2015; in Finland and France the unemployment still continued growing until 2015; the decrease in Luxembourg, Austria and Norway only developed from 2017. Just as in 2009, where men were more strongly affected by growing unemployment, men also benefited more strongly from excellent economic development over recent years – the number of unemployed decreased by 38% in five year comparison, unemployment of women however only by 33%.

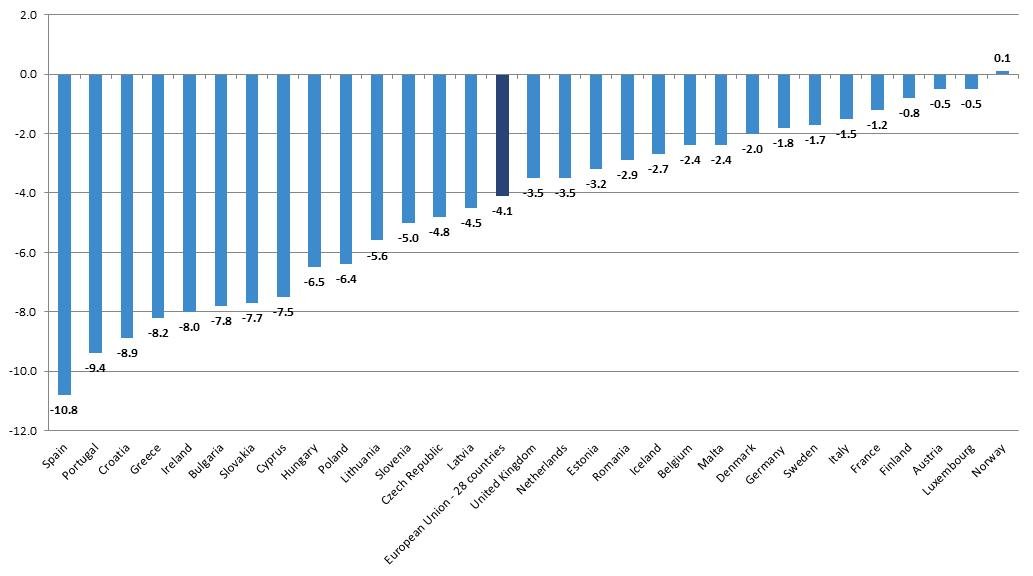
On average the unemployment rate decreased by 4.1 percentage points. Mostly in countries where both the number of unemployed and the unemployment rate (more than) doubled between 2008 and 2013, a favourable trend characterised the following five years with a significant reduction in the unemployment rate. In Greece the unemployment rate increased 3.5 times to 27.5% in the 5-year comparison 2013/2008, in Spain 2.3 times (to 26.1%) and in Cyprus even 4.3 times (to 15.9%). In the annual average of 2018 these rates were respectively at 19.3%, 15.3% and 8.4%.
Also the number of young unemployed peaked in 2013 at 5.640 million; the highest increase after the jump of 23.6% in the annual comparison 2009/2008 was recorded in 2012 with +5.4% when compared with the previous year. This trend was experienced in the majority of the countries – in Germany, Ireland and Latvia the unemployment of young people already started continuously decreasing from 2010; in Italy and Croatia this development started in 2015, whereas in Austria and Norway this trend only emerged from 2017. Unemployment in the age group under 25 was at 3.409 million in 2018, nearly 20% below the level of the year of 2008 (4.245 m). The unemployment rate of young people across the European Union grew from 15.9% in 2008 to 23.8% in 2013 to start continuously decreasing to 15.2% in the annual average of 2018. Youth unemployment rate in Spain and Greece exceeding the 50% benchmark in 2013 (55.5% respectively 58.3%) and reaching 49.9% in Croatia, has particularly fallen quite significantly in these countries.  Figure 4: Youth unemployment rate in 2018 and its change in percentage points in comparison to 2013 / Source: Source: Database – Eurostat une_rt_a
The favourable fall in unemployment since 2013 also significantly changed the focus of the actions of the European network of Public Employment Services. Beyond extensive attempts aiming at reduction of still too high long-time unemployment, our endeavours are even more strongly focused at addressing the shortage of skilled labour and demographic challenges, as well as preparations for digital transformation.
states Johannes Kopf, chair of the European network of Public Employment Services. The following interactive table demonstrates the development of unemployment rates in the respective member states of the PES network since 2008.
Unemployment Rates per country
Please select/search countries below:| wdt_ID | GEO/TIME | 2008 | 2009 | 2010 | 2011 | 2012 | 2013 | 2014 | 2015 | 2016 | 2017 | 2018 |
|---|---|---|---|---|---|---|---|---|---|---|---|---|
| 1 | European Union 28 countries |
7,0 | 9,0 | 9,6 | 9,7 | 10,5 | 10,9 | 10,2 | 9,4 | 8,6 | 7,6 | 6,8 |
| 2 | Belgium | 7,0 | 7,9 | 8,3 | 7,2 | 7,6 | 8,4 | 8,5 | 8,5 | 7,8 | 7,1 | 6,0 |
| 3 | Bulgaria | 5,6 | 6,8 | 10,3 | 11,3 | 12,3 | 13,0 | 11,4 | 9,2 | 7,6 | 6,2 | 5,2 |
| 4 | Czech Republic | 4,4 | 6,7 | 7,3 | 6,7 | 7,0 | 7,0 | 6,1 | 5,1 | 4,0 | 2,9 | 2,2 |
| 5 | Denmark | 3,4 | 6,0 | 7,5 | 7,6 | 7,5 | 7,0 | 6,6 | 6,2 | 6,2 | 5,7 | 5,0 |
| 6 | Germany | 7,4 | 7,6 | 7,0 | 5,8 | 5,4 | 5,2 | 5,0 | 4,6 | 4,1 | 3,8 | 3,4 |
| 7 | Estonia | 5,5 | 13,5 | 16,7 | 12,3 | 10,0 | 8,6 | 7,4 | 6,2 | 6,8 | 5,8 | 5,4 |
| 8 | Ireland | 6,8 | 12,6 | 14,6 | 15,4 | 15,5 | 13,8 | 11,9 | 10,0 | 8,4 | 6,7 | 5,8 |
| 9 | Greece | 7,8 | 9,6 | 12,7 | 17,9 | 24,5 | 27,5 | 26,5 | 24,9 | 23,6 | 21,5 | 19,3 |
| 10 | Spain | 11,3 | 17,9 | 19,9 | 21,4 | 24,8 | 26,1 | 24,5 | 22,1 | 19,6 | 17,2 | 15,3 |
| 11 | France | 7,4 | 9,1 | 9,3 | 9,2 | 9,8 | 10,3 | 10,3 | 10,4 | 10,1 | 9,4 | 9,1 |
| 12 | Croatia | 8,6 | 9,3 | 11,8 | 13,7 | 15,8 | 17,4 | 17,2 | 16,1 | 13,4 | 11,0 | 8,5 |
| 13 | Italy | 6,7 | 7,7 | 8,4 | 8,4 | 10,7 | 12,1 | 12,7 | 11,9 | 11,7 | 11,2 | 10,6 |
| 14 | Cyprus | 3,7 | 5,4 | 6,3 | 7,9 | 11,9 | 15,9 | 16,1 | 15,0 | 13,0 | 11,1 | 8,4 |
| 15 | Latvia | 7,7 | 17,5 | 19,5 | 16,2 | 15,0 | 11,9 | 10,8 | 9,9 | 9,6 | 8,7 | 7,4 |
| 16 | Lithuania | 5,8 | 13,8 | 17,8 | 15,4 | 13,4 | 11,8 | 10,7 | 9,1 | 7,9 | 7,1 | 6,2 |
| 17 | Luxembourg | 4,9 | 5,1 | 4,6 | 4,8 | 5,1 | 5,9 | 6,0 | 6,5 | 6,3 | 5,6 | 5,4 |
| 18 | Hungary | 7,8 | 10,0 | 11,2 | 11,0 | 11,0 | 10,2 | 7,7 | 6,8 | 5,1 | 4,2 | 3,7 |
| 19 | Malta | 6,0 | 6,9 | 6,8 | 6,4 | 6,2 | 6,1 | 5,7 | 5,4 | 4,7 | 4,0 | 3,7 |
| 20 | Netherlands | 3,7 | 4,4 | 5,0 | 5,0 | 5,8 | 7,3 | 7,4 | 6,9 | 6,0 | 4,9 | 3,8 |
| 21 | Austria | 4,1 | 5,3 | 4,8 | 4,6 | 4,9 | 5,4 | 5,6 | 5,7 | 6,0 | 5,5 | 4,9 |
| 22 | Poland | 7,1 | 8,1 | 9,7 | 9,7 | 10,1 | 10,3 | 9,0 | 7,5 | 6,2 | 4,9 | 3,9 |
| 23 | Portugal | 8,8 | 10,7 | 12,0 | 12,9 | 15,8 | 16,4 | 14,1 | 12,6 | 11,2 | 9,0 | 7,0 |
| 24 | Romania | 5,6 | 6,5 | 7,0 | 7,2 | 6,8 | 7,1 | 6,8 | 6,8 | 5,9 | 4,9 | 4,2 |
| 25 | Slovenia | 4,4 | 5,9 | 7,3 | 8,2 | 8,9 | 10,1 | 9,7 | 9,0 | 8,0 | 6,6 | 5,1 |
| 26 | Slovakia | 9,6 | 12,1 | 14,5 | 13,7 | 14,0 | 14,2 | 13,2 | 11,5 | 9,7 | 8,1 | 6,5 |
| 27 | Finland | 6,4 | 8,2 | 8,4 | 7,8 | 7,7 | 8,2 | 8,7 | 9,4 | 8,8 | 8,6 | 7,4 |
| 28 | Sweden | 6,2 | 8,3 | 8,6 | 7,8 | 8,0 | 8,0 | 7,9 | 7,4 | 6,9 | 6,7 | 6,3 |
| 29 | United Kingdom | 5,6 | 7,6 | 7,8 | 8,1 | 7,9 | 7,5 | 6,1 | 5,3 | 4,8 | 4,3 | 4,0 |
| 30 | Iceland | 3,0 | 7,2 | 7,6 | 7,1 | 6,0 | 5,4 | 5,0 | 4,0 | 3,0 | 2,8 | 2,7 |
| 31 | Norway | 2,7 | 3,3 | 3,7 | 3,4 | 3,3 | 3,8 | 3,6 | 4,5 | 4,8 | 4,2 | 3,9 |


Leave a Reply